In this post, Antonio Turiel examines the perspectives of oil production in light of some often neglected parameters: the energy density, the energy yield (EROEI), and realistic estimates of new discoveries. As expected, the result are far from supporting the optimism that seems to be prevalent today.
Translation By Max Iacono
(translated from a previous translation to Italian from Spanish by Massimiliano Rupalti. We’re not professional translators, so please, take this into account while reading it 🙂
)
Dear Readers,
I begin this post as my
preceding one ended: with the graph of the forecast for petroleum production contained in the last annual report of the International Energy Agency (IEA), referring to its central (or main) scenario on New Policies. This graph, as earlier mentioned, shows that on a global level production of crude oil soon will begin its decline. The forecasts of the IEA contain certain elements which are at the very least “slightly optimistic”, to not say outright fanciful, regarding the expected future production from reservoirs yet to be discovered and developed as well as considerably inflated prospects regarding non-conventional oil; based on the latter the IAE obtains a daily production level of 100 million barrels of oil per day (Mb/d) in 2035 compared to the almost 87 Mb/d in 2011. All of this already was commented in my last post.
Carlos de Castro made an interesting comment to this same post about the correct interpretation of the figures in this scenario. It made me think of a small exercise, with simple numbers, to demonstrate that even in the marvelous scenario envisioned for the future by the IEA, the figures don’t add up. And that even in the best of hypotheses for the future, we are entering already the stage of petroleum decline. Let’s have a look:
I took the above graph, and I brought it to high definition (600 dpi) and measured the relative height of the bars. Then by a simple rule of 3, I converted the bars to an equivalent amount of production for each year shown, expressed in Mb/d. Here are my results:
2000 65.9 65.9 65.9 73.8 74.9 74.9 76.7
2005 70.0 70.0 70.0 79.7 82.0 82.0 83.9
2011 68.2 68.2 68.2 80.2 83.2 84.4 86.2
2015 64.1 68.2 68.2 82.6 86.8 89.3 91.7
2020 56.3 65.3 66.5 82.1 88.0 91.1 94.0
2025 48.0 61.1 65.9 82.1 89.2 93.3 95.8
2030 36.7 56.4 65.3 82.1 90.9 94.6 97.6
2035 25.9 52.2 65.3 83.2 93.3 97.0 100.0
Logically, and given the method used, these figures have a certain margin of error, but it is certainly small enough. (for instance, for 2035 the total production of petroleum I obtain is 100 Mb/d whereas the report indicates that it is 99.7 Mb/d and therefore the error in the figures I provide relative to the actual ones by the IEA should be less than 0.5%)
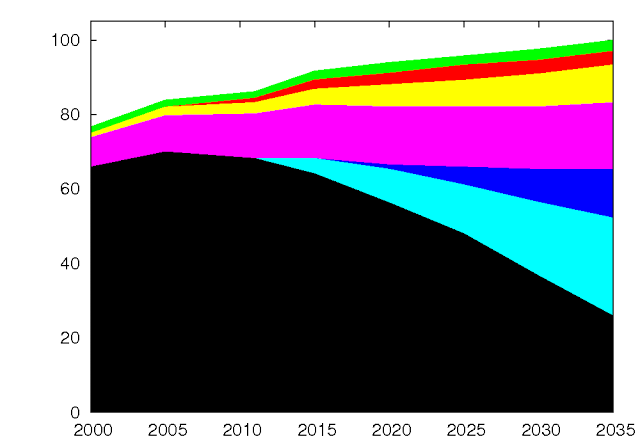
With this as my starting point I prepared a continuous graph (a simple linear extrapolation for the years for which we don’t have data); the colors approximately correspond to those of the IEA graph:
Let us recall the various categories: The black band at the bottom shows the production of crude oil currently in production (2011). The band in light blue shows the production of crude oil reservoirs which are knownalready but which are not being exploited either because of lack of demand or due to excessive production costs. The band in blue shows the production of crude oil which should come from reservoirs yet to be discovered. All the other bands represent non-conventional oil and imperfect petroleum substitutes. The purple band represents the production of liquids from natural gas, the yellow one comes from the production of all main non-conventional petroleum except shale oil, the red band represents shale oil and the green one (different from the color used in the IAE report) represents improvements in refining.
Represented in continuous form, even if with a linear extrapolation between consecutive points, one can obtain a more complete idea of the scenario which the IEA considers the closest to the future course of events. In particular, the gentle decline in crude oil production becomes more noticeable.
But coming back to the comment by Carlos de Castro, this graph obscures a fundamental fact. We are adding various categories of hydrocarbons assuming they are equivalent, when in fact, they are not. Non-conventional oils, (all of them) have lower energy densities per volume, and roughly 70% that of crude oil. In addition, the refining improvements refer to the increase in volume of products derived from the refining of petroleum, and such an increase in volume obviously does not assume an increase in the energy which is extracted from the petroleum. This does not mean that the products refined starting from a barrel of oil contain exactly the same energy as a barrel of oil, or even less, given losses during the transformation process. (the
Second Law of Thermodynamics is ever present and operative) In reality such products contain more energy than that of the original barrel because their processing uses natural gas for the hydrogenation of the less saturated hydrocarbons. What obviously occurs is that the energy of the refined products from a barrel of oil is equal to the energy of the original barrel plus that of the natural gas used in refining it. Making these adjustments (non conventional oils have about 70% of the energy by volume as normal crude oil(*), the improvements in refining do not increase the energy of the petroleum), we then obtain the following graph in millions of barrels of oil equivalents to crude oil per day:
This is the graph which the IEA should have presented if it had counted properly, that is, by reporting energy flows, not volumes. As one easily can see the prospects for an increase in production when expressed in terms of associated energy are much more meager and less attractive: We will go from 79.5 Mb/d (now understood as energy equivalents) in 2011 to 87.5 Mb/d in 2035.
Notwithstanding all of this the graph still does not tell the whole story given that it is a graph of gross or total energy that does not tell us how much energy actually remains available to society once the energy required for its mere production – the energy required to maintain such energy flows- is subtracted out.
To do an estimate of the net energy we need to know the
EROEI (Energy Returned on Energy Invested) of the various sources of hydrocarbons mixed in with the petroleum. Remembering that the EROEI is obtained using the following formula:
EROEI = Te/Ep
Where Te is the total energy produced by a source and Ep is the energy required for its production with both taken over the entire usable lifetime of the source in question. I will assume that given the elevated number of reservoirs and production systems, that the overall production system is in dynamic equilibrium and that both Te as well as Ep can be taken as snapshot values (a simplification which in reality softens the decline). With this formulation, the net energy En which an energy source delivers during its useful life (and if we have many sources at different moments of their useful lives it is equally valid as a snapshot of the whole) is:
En = Te – Ep = Te x (1 – 1/EROEI)
We only need to know the EROEI values for all the various categories in the graph of the IEA. Coming to know those values is a difficult task and not exempt from controversies, depending on the methodology used. I will not present an in-depth discussion of all such values. I simply will propose a few which appear reasonable to me. Since the numbers are on the table, anyone can play with them and propose those changes which appear most reasonable and valid to them, and thereby obtain one’s own version. It also can be said that this exercise should have been done by the IEA itself, so as to provide a clearer idea of what will be the future of the actual availability of energy to society. (because providing the gross figure which includes the cost for the implementation and maintenance of the systems of production for petroleum, is rather deceptive) Here are my own values; they are all constant over time, which in reality makes the decline more gentle;
+ For crude oil presently in production I assume an EREOI value of 20, in keeping with the most typical estimates. Such a high value has little impact, given that it subtracts out only about 5% of the net energy.
+ For the more expensive crude oil which is not being extracted I assume an EROEI of 5. Some authors quantify it as even 3 or 2, others 10. The value of 5 seems to me a reasonable compromise: sufficiently small to explain that some of these reservoirs could not be developed economically up to now, but sufficiently large to allow that now, with higher prices, they can be brought into production. All this implies a return of net energy about 80% that of the gross energy.
+For the petroleum which is yet to be discovered I assume an EROEI of 3. The reservoirs to be discovered are mainly in deep waters, where typically one has to drill 4 or more dry wells before drilling one which actually produces petroleum. In addition such oil has rates of decline which are more rapid than those of petroleum through simple platforms or on land, which implies having to drill more, or do horizontal drilling. It also has greater problems of maintenance and much of it is found in tropical areas where hurricanes can require periodic shut-downs and also can do damage thereby increasing the production costs in terms of Ep. Arctic petroleum is also part of this category and with analogous difficulties. Here the return of net energy is roughly 66% that of gross energy.
+For non-conventional petroleum, including shale oil, I assume an EROEI of 2. This category includes mainly bio-fuels with an EROEI of 1 or less and the shale oils which have an EROEI of 3 or less. This means that only 50% of the gross energy comes to be utilized as net energy.
Taking into account all of these values one obtains the following graph:
This graph too should have been produced by the IEA if it took seriously its own work and, as you can see, explains a story quite different from the official one. According to this same graph the net energy from all petroleum liquids, even according to the highly inflated future forecast by the IEA, would reach its peak around 2015, with a maximum value of 79.7 Mb/d in 2035. In short, we would find ourselves very close to the zenith of net petroleum energy, an extremely alarming message.
What would happen if instead of suggesting such inflated estimates as those of the IEA, we took a little bath in cold realism? It is difficult for me to do a precise estimate of how the production of the various categories of liquids assimilated in petroleum will proceed in reality. (at least for myself who is not a geologist, although the members of ASPO have good estimates for all of them) Nonetheless it is rather easy to do a slightly more realistic approximation regarding the real future of petroleum production. (An approximation which of course could be discussed, if one wishes). Here I leave the hypotheses and the numbers so that whomever may wish to, can repeat the calculations as they prefer.
+Regarding those reservoirs yet to be discovered, it is well known that the estimates of the IEA assume a pace of discovery which is four times greater than that of the past 20 years. Add to this also the fact that in a context of economic instability the tendency of large oil companies is not to invest further in exploration and development, but instead invest less. (from 2008 to 2009 investment has fallen by 19% recovering only by a small amount during the following years when it should have grown enormously to compensate for the growing difficulties in production. In fact
many oil companies have pulled in their oars and have renounced the continuing search for more petroleum. Consequently I reduce this quantity by one quarter of that estimated by the IEA.
+With respect to the natural gas liquids, only one third of their mass content contains sufficiently long hydrocarbon chains to allow being utilized as fuel for present cars, refined as gasoline (but not diesel,
a fuel which poses many specific challenges). One would have to do significant modifications to existing gasoline engines so they could use directly the lighter gasses (the name “natural gas liquids” is fairly deceptive) that is, the propane and the methane (one also can synthesize ethanol starting with ethane and use it directly). The costs of adaptation are not that high but nonetheless require a certain amount of investment, towards which society is little predisposed in times of crisis and, moreover, is something only effective for gasoline engines (whereas in Europe the greater part of private transport runs on diesel oil and all heavy transport vehicles throughout the world run on diesel). To be generous I accept that one third of these natural gas liquids can be used as petroleum substitutes.
+The rest of conventional petroleum I leave as is.
With these premises, the graph of net energy that we obtain is as follows:
The results are easily visible: The year of the beginning of terminal decline in net energy is already here. In reality it could be any year from now until 2015 since the data which I provided are discretized by 5 year periods and moreover the dating cannot be more precise than that shown. On the other hand it also should be said that the peak in net energy does not mean the peak of all energy, given that a great part of the sources still have somewhat of a margin for their decline and in part will compensate for this fall. Nonetheless, to the extent that the decline in petroleum will be stronger, the fall will be more difficult to compensate and at a given moment not far away, – also associated with the exhaustion of growth of the major portion of the sources-, the fall will be inexorable. As a final point I also would like to highlight that the fall in net energy from petroleum will not be recognized until the fall in its volume also becomes evident (as was shown in the first graph), given that the concept of net energy is more difficult to grasp.
We know already that classic economic education cannot recognize the concept of EROEI and therefore the explanation which will be given when petroleum production will decline, will be that there is insufficient investment in exploration and development (as already is occurring in Argentina), without understanding that the economic accounting cannot come right, if the energy accounting doesn’t. This will give rise to heated debates which will lead to wrong policies that will do more harm than good, to more radicalized positions, and to the final adoption in many cases of draconian measures of populist character, which will resolve nothing and in fact will aggravate the lot.
The final fact is that the petroleum era has come to its end. Petroleum will continue to be available for many decades but always in lesser quantities and in the end it will become a luxury good. Our epoch of accelerated economic development based on
inexpensive petroleum is already over. It is the sunset of petroleum. And if we are unable to recognize it, it
could also very well be our own.
http://www.resilience.org/stories/2013-02-05/the-twilight-of-petroleum